Tenerife Comercio: a georeferenced commercial atlas
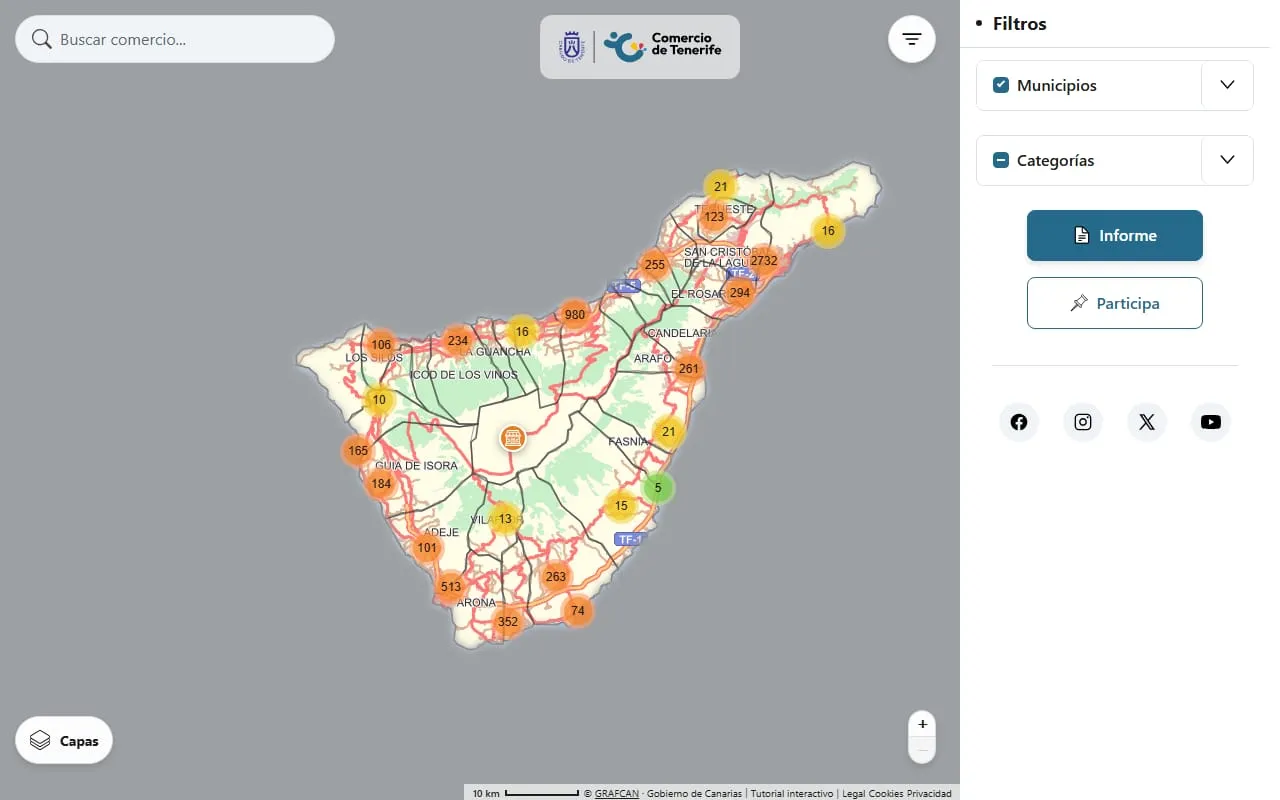
Redesign and extension of the Cabildo de Tenerife's commercial atlas: an interactive map of about 40,000 businesses with socioeconomic layers, downloadable reports and a data pipeline built on official statistics.
- Role
- Developer and maintainer; the only developer on the codebase
- Client
- Cabildo de Tenerife, Data Bank and Documentation Centre unit
- Status
- The new version has not been published yet; the live site is the previous one
- Stack
- Joomla 6, PHP 8.2, vanilla JavaScript (ES modules), Leaflet, Chart.js, jsPDF, Python, Figma
Context
The Data Bank and Documentation Centre of the Cabildo de Tenerife has spent more than 30 years collecting information about the island. Its Commercial Atlas, created in 2012, gathers the commercial, industrial and socioeconomic activity of Tenerife and shows it on a georeferenced map. Its purpose is to promote local commerce and to help people start a business.
The challenge
- Bring content that was spread across several places (aid and subsidies, business data, guidance for starting a company, application forms) into one coherent site.
- Give the map the socioeconomic context needed to judge a business's viability in each area, with data that anyone can verify.
- Make the tool usable for people with no technical training.
- Keep the platform stable and documented, so it does not depend on a single person.
What I did
Redesign and integration
- Designed the new interface in Figma, validated with the unit, and built it in Joomla with HTML, CSS and JavaScript: modular components, responsive layouts and shared colour variables for a consistent look.
- Merged scattered content into one site, including the contents of a separate small-business website, and upgraded the portal to Joomla 6.
- Built three custom Joomla components: the map and its data pipeline, a business-plan form that generates a PDF, and a form to suggest new businesses.
The interactive map
- A Leaflet map with search and filters over about 40,000 businesses.
- Selectable socioeconomic layers: average income, population density, ageing, country of birth of the foreign-born population, nearby facilities, tourist accommodation, public transport traffic and accessibility for people with reduced mobility.
- A redesigned layer selector (grouped by type, with icons and contextual help showing the source of each dataset) and a toggle for street and place names, useful over the satellite view.
- A "selectable area" tool: draw any zone on the map and get the report for the businesses inside it, instead of being limited to a municipality.
- A downloadable report (screen, CSV and PDF) with comparative charts per municipality and a citation of the source for each figure.
Data and verification
- Python scripts that download statistical data from the Spanish national statistics institute (INE) and the Canary Islands institute (ISTAC) and turn it into the JSON the map reads.
- Cross-checked each variable across official open-data sources, including the Cabildo's own data portal, before publishing it on the map.
- Fixed data-quality problems found along the way, such as municipality names that did not match between sources, and assigned a municipality to records that had none by computing it geographically.
Technical decisions
- Vanilla JavaScript, no jQuery or frameworks. The five third-party libraries are served from the site itself rather than from a CDN, and the heavy ones (Chart.js and jsPDF) are only downloaded when someone opens the report or exports a PDF.
- File-based data instead of custom database tables: the map reads static JSON generated from CSV files, and that data is read-only at runtime.
- WebP thumbnails for the business photos: 24,132 images about 36% lighter on average. I also tested AVIF and discarded it: roughly 40% smaller, but about 870 ms per image to generate in PHP for only about 7 KB more saved per popup.
- A report variable (available premises) was removed at the unit's explicit request once it stopped being relevant to the analysis.
Quality and maintenance
- Fixed a caching problem that could make returning users see an outdated version of the map after an update, and several display details on mobile devices.
- Wrote headless smoke tests for the PDF generator and for the map modules.
- Documented the project (development manual, changelog and a feature catalogue) so any technical person can maintain it.
By the numbers
From a snapshot of the repository in September 2026 (version 0.8.0):
- About 40,000 businesses on the map.
- 602 commits in about 8.5 months, all by one developer.
- About 35,000 lines of own code in 148 files: JavaScript 36%, PHP 26%, CSS 21% and Python 16%.
- Five third-party libraries, all served from the same domain, and no custom database tables.
Result
- The atlas now includes the socioeconomic variables planned for it from the start.
- Every variable shows its source, on screen and in the report, so anyone can check where a figure comes from.
- The layer selector and the area tool make the map easier to use for people without technical training.
- The project is documented, so its knowledge does not depend on one person.